视频解析
文字解析
Arithmetic I
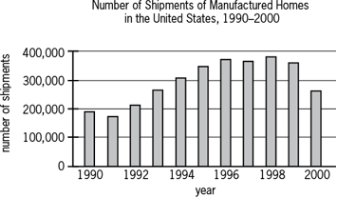
From the chart, the approximate numbers of shipments are as follows:
| Year | Number of Shipments |
| 1990 | 190,000 |
| 1991 | 180,000 |
| 1992 | 210,000 |
| 1993 | 270,000 |
| 1994 | 310,000 |
| 1995 | 350,000 |
| 1996 | 380,000 |
| 1997 | 370,000 |
| 1998 | 390,000 |
| 1999 | 360,000 |
| 2000 | 270,000 |
Since there are 11 entries in the table and 11 is an odd number, the median of the numbers of shipments is the 6th entry when the numbers of shipments are arranged in order from least to greatest. In order, from least to greatest, the first 6 entries are:
| Number of Shipments |
| 180,000 |
| 190,000 |
| 210,000 |
| 270,000 |
| 270,000 |
| 310,000 |
The 6th entry is 310,000.
The correct answer is C.
GMAT会员
- 【OG18-P680-668题】In a review of 2,000 studies of human behavior that date back to the 1940s, two Swiss psychologists, declaring that since most of the studies had failed to control for such variables as social class and family size, none could be taken seriously.
- 【OG18-P680-671题】Manufacturers rate batteries in watt-hours; if they rate the watt-hour higher, the longer the battery can be expected to last.
- 【OG18-P680-672题】At the end of the 1930s, Duke Ellington was looking for a composer to assist him-someone not only who could arrange music for his successful big band, but mirroring his eccentric writing style as well in order to finish the many pieces he had started but never completed.
- 【OG20-P569-634题】Snowmaking machines work by spraying a mist that freezes immediately on contact with cold air. Because the sudden freezing kills bacteria, QuickFreeze is planning to market a wastewater purification system that works on the same principle. The process works only when temperatures are cold, however, so municipalities using it will still need to maintain a conventional system. Which of the following, if true, provides the strongest grounds for a prediction that municipalities will buy QuickFreeze's purification system despite the need to maintain a conventional purification system as well?
- 【OG20-P147-8题】(12 -13 )+(13 -14 )+(14 -15 )+(15 -16 )=

添加官方小助手微信
了解更多GMAT考试与咨询


 400-1816-180


 资深讲师题题有解析


 12G备考资料